Challenge - Village Software Data Quest
We were pointed towards the Village Data Quest by Matthew Crossley through our student email, and I was personally intrigued, especially with a description of what the challenge would entail (partly), which is given below:
You and your team are competing against others in real time to find the most valuable packages of land to claim.
You are presented with a 1000 x 1000 CSV grid, representing a type of natural resource found in the land. Each cell will have a value from 0 to 100 for each resource, and each resource has a value.
Your main objective is to find and claim the most prosperous 10 x 10 pieces you can on the grid. Claiming a grid happens on a first-come, first-served basis. Once you have claimed a piece of land, no one else can claim any cells in it.
I asked Iqrah Nadeem if she was interested in attending with me, and she was.
Pre-challenge
Given the challenge, I developed a solution for a given CSV file, which can be seen on this commit of my GitHub solution. They recommended doing this before the event to prevent issues loading CSV files on the day, as we should be dedicating time to Data Science.
I decided to use JavaScript since I am extremely familiar with it, and it's not too demanding to perform such calculations. Additionally, if time allowed, I could easily visualize what my solution is doing on a canvas after console logging the needed results before rendering.
Essentially, the script I wrote passes over every possible 10x10 block, sums the values held within, and stores the position of that block (along with the total value) within an array.
I also generated test data within this script, which can be seen here. It yielded correct results, although in the early stages of development, rich plots usually overlapped due to the resource locations being situated in certain locations.
To combat this, I developed a function called getUniquePlots that runs over the given plots. This function ensures uniqueness, leading to a complete implementation of a fast algorithm (seconds to compute) for the information we were given.
Note: If you run this code, you might run into a CORS issue. This is due to how I am loading the CSV file via an XMLHttpRequest. To solve this, you can install a browser plugin to prevent this issue.
The Day
After a brief introduction from Village, we were given more information about the challenge. Three additional rules were introduced:
- There would be four CSVs, one for each resource (Gold, Iron, Wheat, and Oil).
- We had the trade value of each resource for the past 6 months.
- We had to sell resources from ALL claimed plots on a given month.
With these new rules, developing a sufficient algorithm within a few hours became extremely challenging because time was a factor across resources, rather than just whole plots.
We decided that if we took the current value of all given plots of land and sold resources at their peak selling price, it would still produce highly favorable results, although not completely guaranteed to be the most prosperous.
To incorporate the new CSV files and find the most prosperous plots, we first used what I had developed before the new rules to iterate over the total area (still a 1000x1000 piece of land), although this time not directly from the CSV file.
I created a recursive function that popped a string for each file from an array into another array, which held the data from that file. After it finished, the data was passed to a new function that converted it from a string to a 2D array.
With each array, I multiplied them by their corresponding value (for (var k = 0; k < arrays[i][j].length; k++) arrays[i][j][k] *= values[i];), then summed every array together. From here, it was passed to the function I created before the event and logged.
Submission
We were one of the first to submit our claims, with only two claims made by another group before us. We claimed our desired plots of land (using linear regression to decide the best time to sell each resource) and were confident in our choices.
However, halfway through the hour, when we had to submit our plots, the organizer of the event (who produced the challenge), Dominic Bisset, asked us if we accidentally flipped the x and y coordinates. It turned out that a reversed plot yielded a far more prosperous piece of land, and during testing, he made the exact same mistake.
Upon inspecting my code, I found that on the following few lines, the x coordinate correlated to the j variable in my loop, not i, which cost us the grand victory.
    // finding the value of every possible plot
    for (var i = 0; i < arr[0].length - size; i++) {
        for (var j = 0; j < arr.length - size; j++) {
            jsonResults.push({
                total: sumOfSize(i, j),
                x: i,
                y: j
            });
        }
    } jsonResults = jsonResults.sort((a, b) => b.total - a.total);
    // simple lambda function to sort
Fortunately, there was still the "Persuasion award," and I was confident we would win it with my experience in presenting workshops and mentoring, teaching ideas, code, and algorithms in understandable ways. Iqrah also spent most of her time creating a smooth presentation for this element.
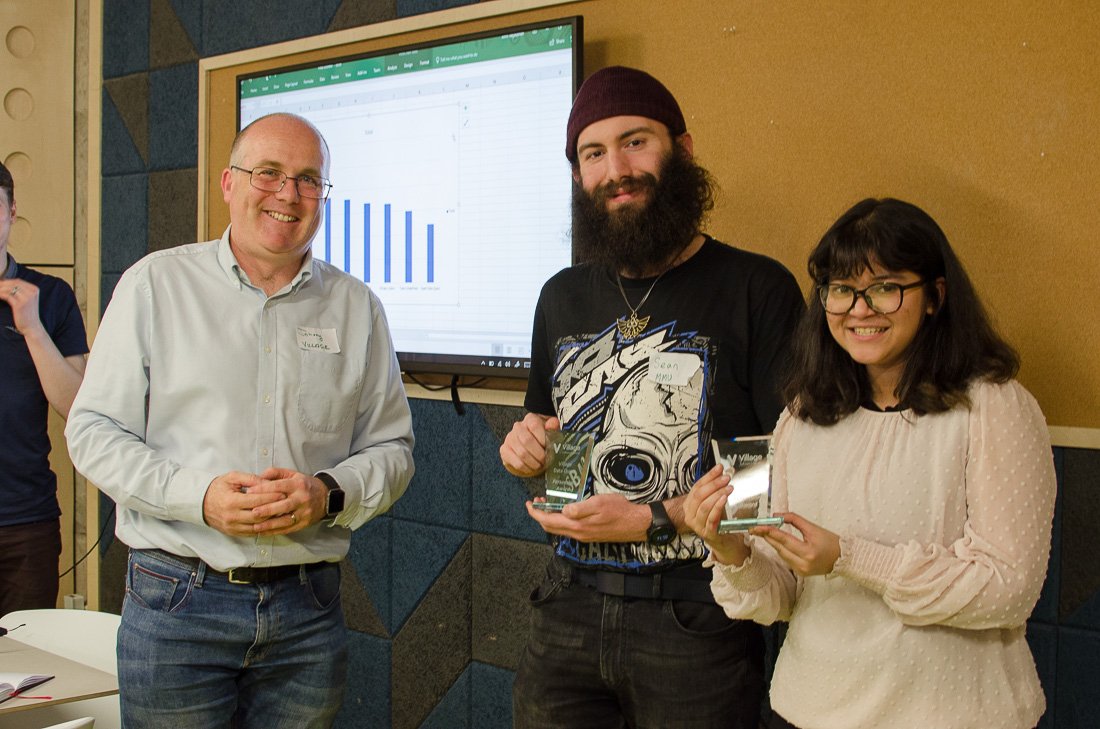
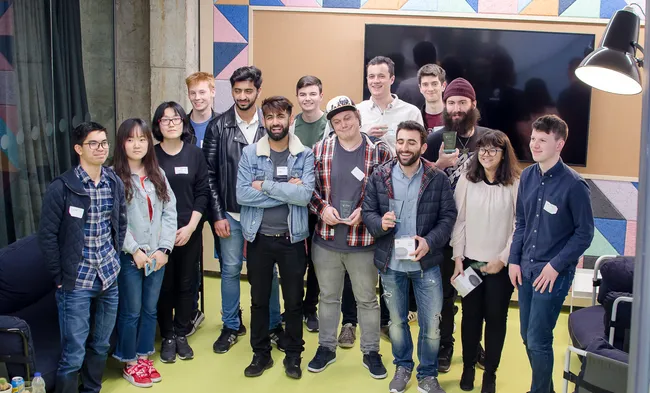
WE WON THE PERSUASION AWARD, along with a Google Home Mini each. It was such a great day, and I hope Village runs another Data Quest. They have also written up their own blog post, which is worth checking out for an overall round-up of the event.